

Every school in your district. One view.
District & School Insights rolls Pass activity from every school you administer into one reporting workspace. Compare buildings, track this year against last year, and deliver scheduled reports to the people who need them, without exporting a single spreadsheet by hand.
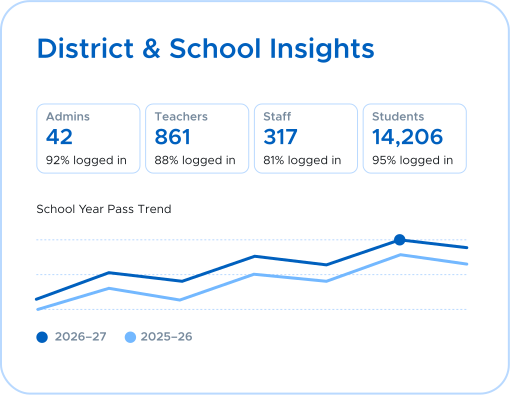
14 reporting charts
covering pass volume, duration, destinations, tardies, visitors, and login activity
One selector, every school you administer
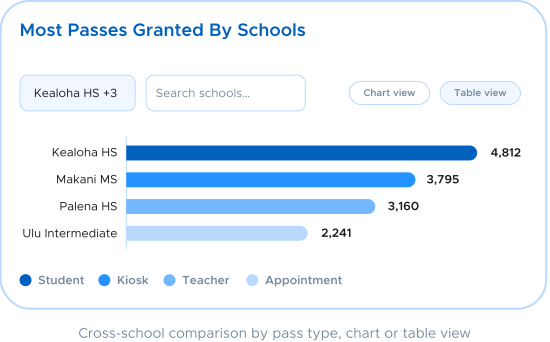
Pick one building, a subset, or all schools, and every chart rolls the selection together. When you want buildings side by side, the school comparison chart ranks pass activity across your top schools, broken out by pass type, in chart or table view.
- View one school, multiple schools, or all authorized schools
- Compare pass activity across schools, up to your top ten
- Access scoped to your school memberships, validated on every request
This year versus last year, without the spreadsheet
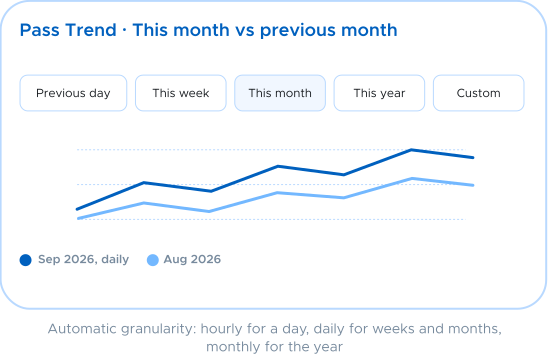
Every preset view carries its own comparison. Yesterday against the day before, this week against last week, this month against last month, and this school year against the previous one. Granularity adjusts automatically, from hourly detail up to month-by-month trends across the academic year.
- Prior-period comparison built into every preset date range
- School-year views run July through June, matched to your calendar
- Trends for passes, tardies, visitors, and adults granting zero passes
Rankings that respect student privacy
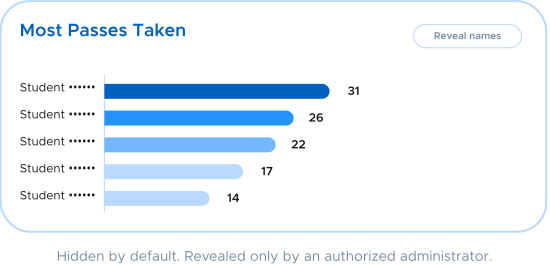
Charts that rank individual students, like Most Passes Taken and Contact Control, load with names hidden. An authorized administrator chooses when to reveal them. Your data stays useful in a room full of people, and identities stay protected until someone with the right role decides otherwise.
- Names hidden by default on student-level ranking charts
- One-click Reveal Names, restricted to admin roles
- Access limited to admin and superadmin, never teachers or students
Reports that deliver themselves
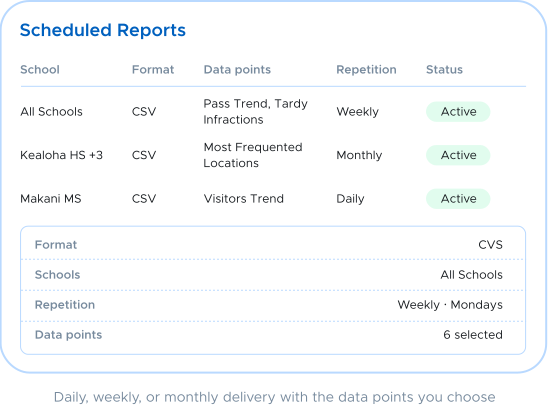
Download or email the data points you select as CSV, scoped to your chosen schools and date range. Or set it once and let Pass handle it: scheduled reports run daily, weekly, or monthly, and the Scheduled Reports screen keeps every delivery visible and manageable in one list.
- Download, email, or schedule any selection of data points
- CSV output that drops straight into your existing BI workflow
- Daily, weekly, and monthly repetition with start and end dates
From building-by-building guesswork to district-wide clarity
One live dashboard for student movement data across every school you oversee

Multi-school rollup
One school, a subset, or all schools you administer, rolled into every chart with one selector.

Prior-period comparison
Day, week, month, and school-year views each compare against the period before, automatically.

14 reporting charts
Pass volume, duration, destinations, graduation-year breakdowns, tardies, visitors, and login activity.

Privacy-first rankings
Student-level charts load with names hidden until an authorized administrator reveals them.

Custom chart layout
Show or hide charts and drag them into the order your leadership meetings actually follow.

Scoped admin access
Admin and superadmin roles only, with district and school scope validated on every request.
How it works
From raw pass data to board-ready answers in three steps

Step 1: Select
Choose one school, several, or all schools you administer. Every chart rolls your selection together instantly.

Step 2: Compare
Track trends against the prior day, week, month, or school year, and rank activity across buildings, locations, and pass types.

Step 3: Deliver
Download or email the data points you need as CSV, or schedule daily, weekly, or monthly delivery and let Pass handle the rest.
One platform for student movement
District visibility from the platform your schools already run
Standalone analytics tools mean another data pipeline, another vendor review, and another export to babysit. District & School Insights reads the pass, tardy, and visitor activity your schools already generate in Securly Pass, so district leaders get answers from day one and IT gets nothing new to deploy, integrate, or maintain.
"When we saw the Securly Pass dashboard showing every student with a hall pass and where they were going, we were like, 'Oh my God! This is the Holy Grail!' The team was immediately hooked." — James Arndt, Former Head Principal, Camelback High School
District & School Insights FAQs
See your whole district in one view
Roll up pass, tardy, and visitor activity across every school you administer. See District & School Insights in action.